Dave G3WUN
Experimental setup
Conclusions
Detailed summary
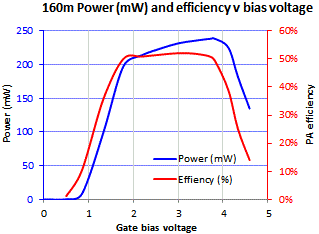
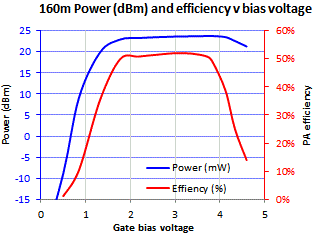
160m band detailed results
80m band detailed results
30m band detailed results
10m band detailed results
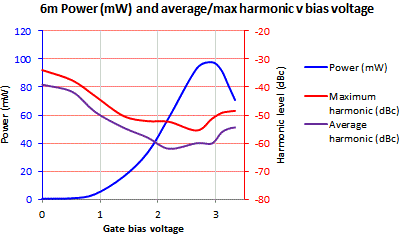
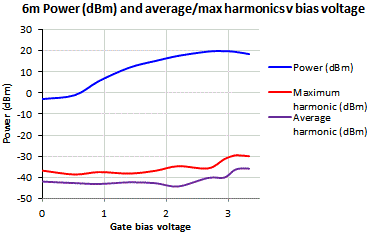
6m band detailed results
Dave G3WUN
An email was received from Dave G3WUN, following some discussion on the QRP Labs forum on obtaining higher RF power output. Dave questions the ever-ending quest for more power, pointing out that after all the "W" in WSPR does stand for "weak" and we are dealing in general with supposedly weak-signal modes, here. The exception being LF bands etc where very poor antenna efficiencies often need higher powers to compensate. Dave reports that when the bias potentiometer is adjusted for "maximum smoke" (highest output power), the spectrum analyser shows the harmonic levels quite clearly. But backing off the potentiometer a little, the amplitude of the harmonics reduces to zero, with only slight reduction in the wanted fundamental signal.
Dave provides the following photographs showing the spectrum and measured 186.5mW output power, when the potentiometer is adjusted for maximum output:
Here is the spectrum, and reduced power output at 131.3mW, when the potentiometer is adjusted instead for minimum harmonics level. In fact the harmonics disappear completely. However Dave does have a 30dB HP attenuator in line, as well as the attenuation in the spectrum analyser. This is why his fundamental is at -10dBm.
Experimental setup
I decided to try and repeat Dave's results here and get some better idea of the best bias voltage level, differences with other bands etc. The spectrum analyser here is an Advantest R3361C (with 50-ohm input). The U3S output was fed directly into that. One DVM measures bias voltage (0-5V), one DVM measures PA current (0-200mA). I had available here QRP Labs LPFs built for 160m, 80m, 30m, 10m and 6m. So these are the bands which I tested, and are quite a reasonable spread of frequencies.
The photos below (click for larger versions) show the general setup. The Ultimate3 kit is one of several in use for various purposes in the lab, but all are battered and mutilated by the effects of many experiments and developments. The U3 was set for continuous FSK QRSS output with 0Hz FSK. Effectively just a continuous key-down. Frequencies used where 1.900, 3.500, 10.140, 28.000 and 50.000MHz.
The U3 configuration is completely standard. 25 turns on the FT37-43 toroid; one BS170, at PA voltage 5V. No relay board, just the single LPF plugged into the main U3 PCB.
Another thing I wanted to check, was how good is my favourite method of adjusting the PA bias? This method involves watching the overall current consumption of the U3S, on key-up (idle, e.g. you are editing the menu, so the transmitter is off). First have the bias potentiometer completely anti-clockwise. Observe the current, and turn it clockwise gradually until you just about observe the overall current consumption start to increase. This is the correct bias point. Whilst it is not necessarily the maximum power output, it is a reasonably good power level, without such a high idle current that the BS170 overheats, and it works well for me. This method has the benefit of not being band dependent, not requiring any power meter, and being very simple to do.
When I do this procedure using the current display on my homebrew shack PSU which has a display of 0 - 5A with 0.01A resolution, the idle current of the U3 is 0.07A. I increase the bias voltage until I just about see 0.08A indicated. Measurement at the wiper of the bias potentiometer shows the bias voltage is 2.19V, in my case (it will vary on a case by case basis!). So I made sure to include a measurement at 2.19V bias in each of my band measurements.
DO NOT BE TEMPTED TO ADJUST FOR 2.19V, OR INDEED ANY VOLTAGE! EVERY DEVICE IS DIFFERENT! ADJUST FOR A SLIGHT INCREASE IN BIAS CURRENT!
Harmonic level was noted on 2nd, 3rd, 4th, 5th and 6th harmonics. Higher harmonics were not studied. Harmonic levels relative to the carrier are calculated by subtracting the fundamental power level, and expressed in dBc.
Overall conclusions
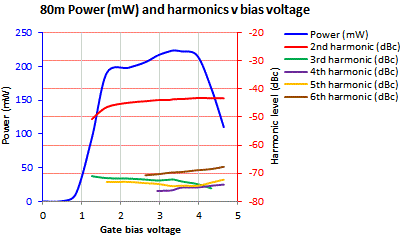
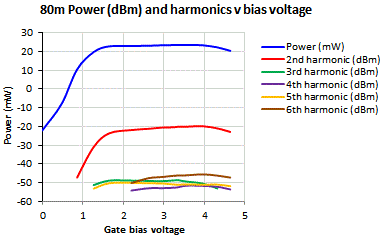
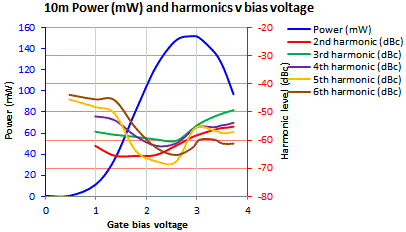
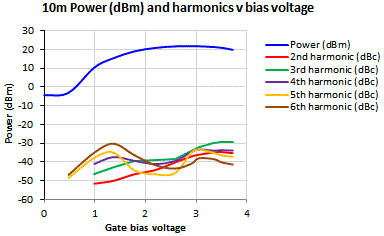
1) I could observe the same effects as Dave G3WUN, though not quite as severely. It is generally the case that at maximum power output the U3S PA produces the worse level of harmonics, than when the bias potentiometer is backed off a little (reducing the output power a bit).
2) The worse harmonic levels don't seem particularly troublesome on 160m and 80m. In fact, the largest effect was on 30m, which happens to also be the band that Dave G3WUN tested on.
3) The best PA efficiency occurred at a lower bias voltage than the bias voltage for maximum RF power output, on all bands.
4) Adjustment of the bias PA is more critical, the higher the frequency - the peak of power against bias voltage is much sharper. Additionally the bias point for highest RF Output occurs at lower voltages the higher the frequency. If you adjust for maximum power on 160m, then when you come to operate on 6m the PA will be overheating considerably, efficiency will be terrible, and you will get little power output at 6m. Therefore if adjusting the PA for highest power output, please do so on the highest operation frequency. That will produce the safest and best compromise of bias voltage across all the bands to be operated.
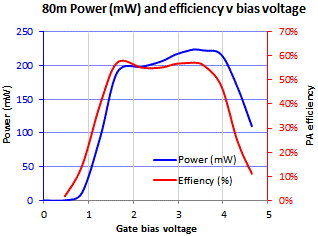
5) As would be expected, power output and efficiency both decrease as the transmitter frequency is raised. However the best PA efficiency (57%) was recorded on 80m (not 160m band).
6) Graphs were plotted at the bias voltage for a) best power output, b) 2.19V bias, c) best efficiency, and d) cleanest output (lowest average harmonic level in dBc). The 2.19V point (above adjustment method) is usually very close to the best efficiency bias level, and the cleanest output bias level! BUT NOTE: EVERY BS170 IS DIFFERENT, THE ZERO IDLE CURRENT BIAS WILL VARY IN EVERY CASE! On 10m and 6m bands the bias voltages are identical (best efficiency = cleanest output = 2.19V). The method therefore produces a very reasonable approximation for the best bias voltage to choose for the PA, across all bands, when you want best PA efficiency and cleanest output (lowest harmonic levels). The output RF power is lower but not by very much (particularly if you look at it in dBm terms rather than milli watts).
Detailed summary
Here's power and efficiency against frequency:


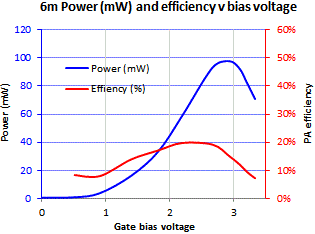
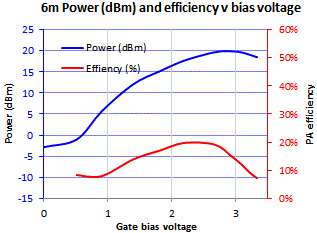
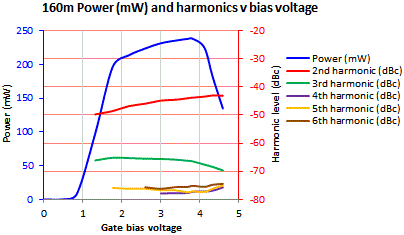
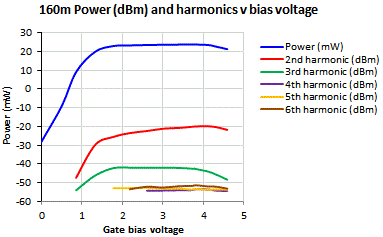
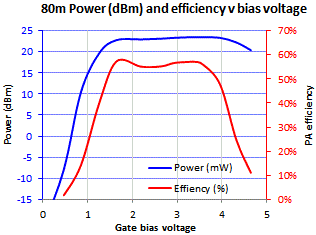
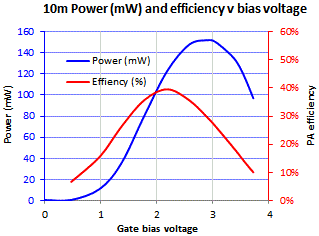
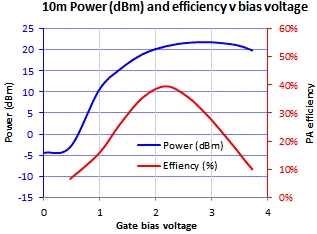
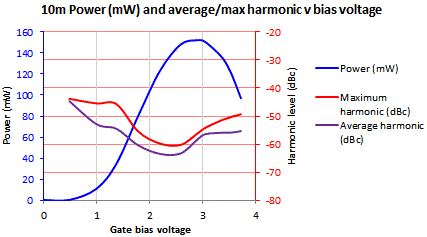
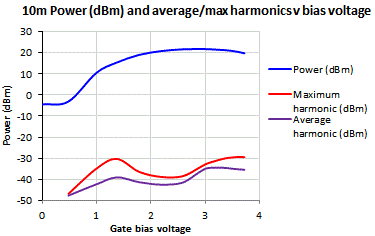
These charts show the power output in mW and dBm as the bias voltage is increased. In the case of the higher frequency bands e.g. 10m and 6m, I stopped increasing the bias voltage when the heat dissipation in the poor BS170 transistor got too much. I kept the overall PA current below 200mA.


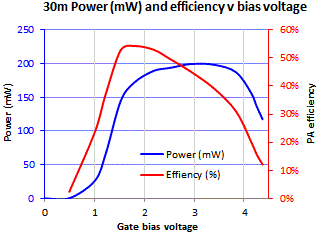
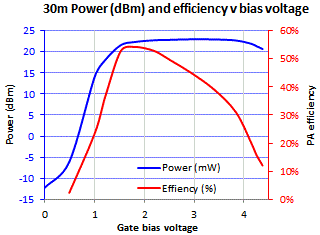
Here's efficiency against bias voltage, on each of the 5 bands. Note that the efficiency on 160m is less than on 80m, and less than the best efficiency on 30m.

The following charts show four lines, which correspond to four different bias voltages:
a) Bias voltage for peak power (blue)
b) 2.19V bias voltage obtained using my favourite method, as outlined above
c) Bias voltage at which best PA efficiency was obtained
d) Bias voltage at which best harmonic levels were obtained (lowest average harmonic level in dBc of the 2nd to 6th harmonics).
Note that on 10m and 6m, the 2.19V bias, best efficiency, and cleanest output are all the same (2.19V bias). So it's an excellent way to set the PA bias, if you are going for best PA efficiency and cleanest output. The sacrifice in power is relatively minor, too.


The efficiency is clearly lowest if you adjust for highest output power (blue curve). See below. Furthermore, efficiency is close to its highest if you adjust for cleanest output, which is also what you get if you use the idle current adjustment method (my 2.19V measurement, see above).

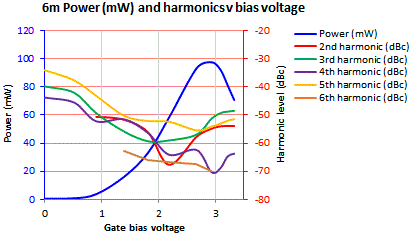
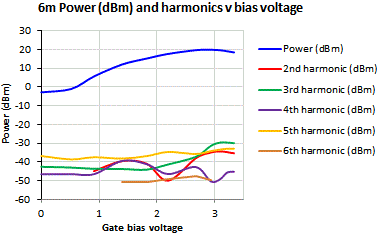
The bias voltage for each case (peak power, best efficiency, cleanest output) does change by band. The idle-current bias adjustment method (my 2.19V) is a good approximation for best efficiency and cleanest output. Particularly so at the higher bands (10m and 6m here) where the lines coincide precisely in my results. Since higher frequency bands are more critical, it is more important to have those best adjusted, than the lower frequency bands.

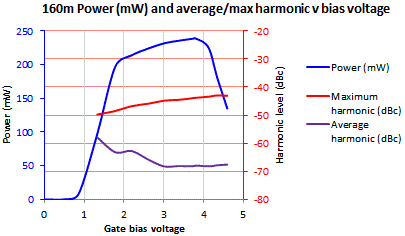
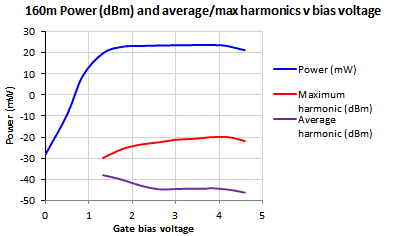
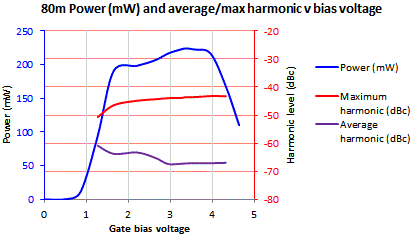
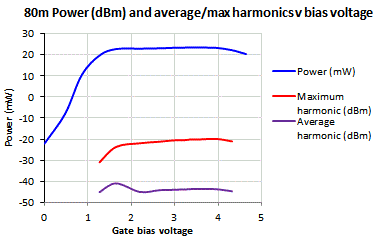
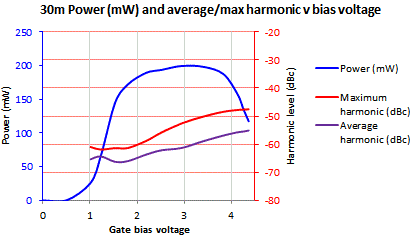
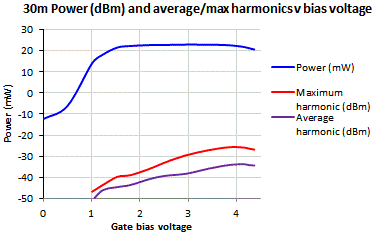
These two charts show the average harmonic level in dBc (average of harmonics 2-6) against frequency (left), and the worst harmonic level (right). It can be seen that on 10MHz (30m) band, the different in worst harmonic level between the maximum power adjustment, and the cleanest output adjustment, is almost 10dB. Again the 2.19V idle-current bias adjustment method can be seen to be quite close to optimum, across bands.


160m band detailed results
Note the flat efficiency and quite flat power output level, across quite a wide range 2-4V of bias voltage.
80m band detailed results
Note again, the wide voltage range of about 2V (1.6 to 3.6V approximately) produces not much change in output power or efficiency. Again this reinforces the point that adjustment for the lower frequency bands is not very critical. It will be best to do any necessary adjustments at the highest intended operation frequency.
30m band detailed results
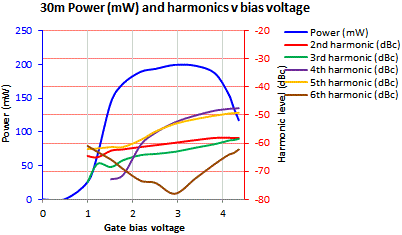
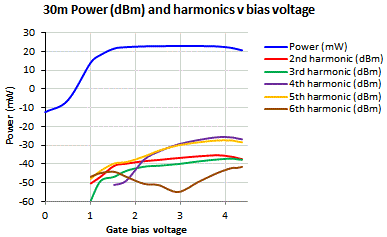
Note the quite close resemblance to the results of Dave G3WUN, mentioned at the top of this page. Now the best efficiency bias point is clearly sharper than it was on 160m and 80m, and quite far below that of maximum power. Note that again, the power increase not much, as the bias increases. There is relatively little sacrifice in backing off the bias potentiometer a little bit.
10 band detailed results
6m band detailed results
